Real-Time Processing
Hour-long audit lag vs compliance → <5s pipeline, 1M+ req/min, ES search <100ms at billions of rows.
Public company context- Role
- Full Stack Cloud Developer
- Context
- Media / Analytics
- Duration
- 10 months
- Team
- 6 engineers + 1 cloud developer (me)
Tech stack
- ECS
- EKS
- Fargate
- Python
- Lambda
- S3
- ElasticSearch
- Redis
- Celery


Business problem and production context.
Business problem
Enterprise clients needed real-time activity tracking and audit logging across distributed microservices. Existing batch processing had delays of up to an hour, failing compliance requirements for near-real-time visibility.
Architecture decision
Operated cloud-native microservices on ECS, EKS, and Fargate handling 1M+ requests/minute. Built audit logging with Lambda, S3, and ElasticSearch for real-time activity tracking. Implemented Celery task queues with Redis and SQS for background job processing.
Before and after.
Audit events stream into a searchable index as they happen, with report generation kept off the real-time path.
The audit logging path, the audit processors and the background job split. The wider ECS and EKS microservice estate is not shown.
Main components only; supporting services are left out.
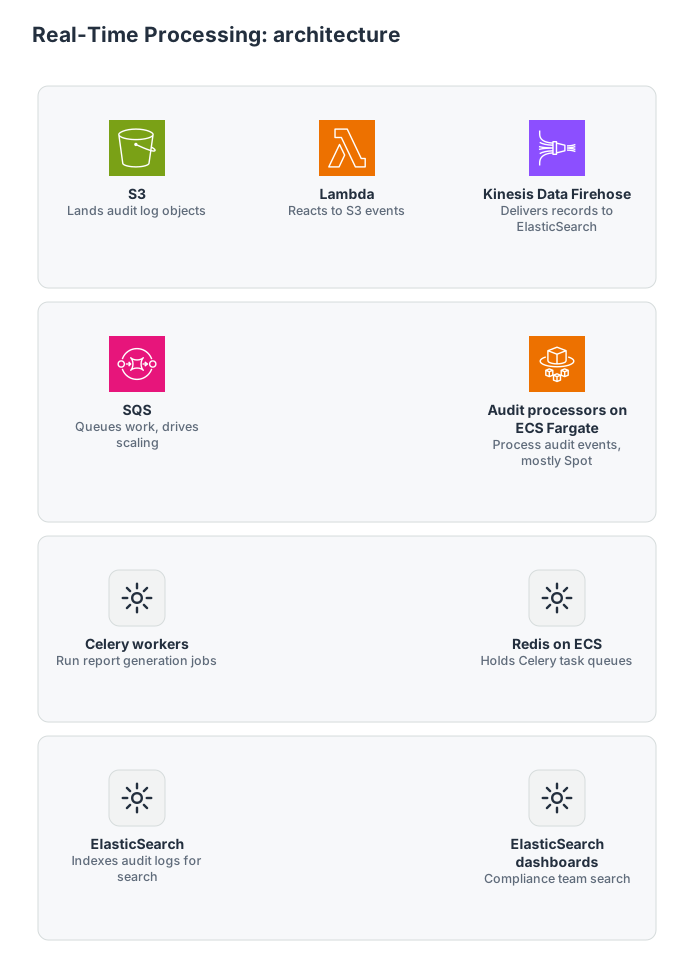
Ingest

S3
Lands audit log objects

Lambda
Reacts to S3 events

Kinesis Data Firehose
Delivers records to ElasticSearch
Audit processing

SQS
Queues work, drives scaling

Audit processors on ECS Fargate
Process audit events, mostly Spot
Background jobs
Celery workers
Run report generation jobs
Redis on ECS
Holds Celery task queues
Search
ElasticSearch
Indexes audit logs for search
ElasticSearch dashboards
Compliance team search
How it works, step by step
- 1Audit log objects land in S3, and each S3 event triggers a Lambda function.
- 2Lambda pushes the records through Kinesis Data Firehose into ElasticSearch.
- 3Audit processors on ECS Fargate take work from SQS and scale with queue depth.
- 4Compliance teams search the audit logs through ElasticSearch dashboards.
- 5Report generation runs as Celery jobs on Redis, away from the real-time logging path.
Guardrails
- Real-time logging kept apart from report generation
- SQS retries and idempotency keys absorb Spot interruptions
- On-demand Fargate base task runs beside Spot capacity
- Index lifecycle policies roll indexes through hot, warm and cold tiers
Considered and not used
- CloudWatch Logs Insights: ElasticSearch was chosen for fast full-text search across billions of log entries.
- Amazon ElastiCache for Redis: Self-managed Redis on ECS gave finer control over eviction policies and cluster topology.
- Hourly S3 to Redshift ETL: Replaced by the streaming path; it was the source of the processing delay.
My part of the work, separate from the team's.
The team behind the engagement is in the facts row above. These are the parts I was responsible for, and the artifacts that show the work.
Owned scope
- Event-processing architecture for high-throughput, low-latency data paths
- Backpressure, queue, and storage decisions around real-time query behavior
- Operational signals for lag, failures, and customer-impacting delay
Evidence artifacts
What would fail first?
Every project has constraints. The useful work is naming them early enough that rollback, cost, and ownership are designed before an incident.
Latency
The system needed fast query responses while ingesting and processing continuous event streams.
Throughput
Burst traffic required explicit handling of queue depth, consumers, and storage limits.
Debuggability
Operators needed to know whether delay came from ingestion, processing, or query serving.
Trade-offs accepted on purpose.
Production risks and how they were controlled.
Small steps, visible changes, fewer surprises.
- 01
Instrumented existing batch pipeline to identify bottlenecks. We discovered the processing delays, up to an hour, came from hourly S3-to-Redshift ETL jobs.
- 02
Replaced batch ETL with streaming architecture: Lambda triggers on S3 events, pushing to ElasticSearch via Kinesis Data Firehose.
- 03
Deployed audit microservices on ECS Fargate with auto-scaling based on SQS queue depth, scaling from 3 to 50 tasks during peak hours.
- 04
Built real-time ElasticSearch dashboards for compliance teams: sub-second search across 2B+ audit log entries.
- 05
Implemented Celery task queues with Redis for background analytics jobs, keeping the hot path (real-time logging) isolated from cold path (report generation).
What carries over to your system.
- ElasticSearch index management is critical at scale. Without ILM (Index Lifecycle Management) policies, the cluster hit storage limits within 3 weeks. Implemented hot-warm-cold tiers with automatic rollover.
- Fargate Spot saved 70% on compute for audit processors, but interruptions caused data gaps. Added SQS-based retry logic and idempotency keys to handle graceful interruptions.
- Separating hot path (real-time audit logging) from cold path (report generation) was the single most impactful architectural decision: it eliminated resource contention during peak hours.
Rollback path
Processing changes needed replay-safe deployment and clear boundaries around idempotent writes.
Cost considerations
Cost control depended on matching retention, throughput, and query capacity to actual access patterns.
Observability notes
Useful signals were ingestion rate, processing lag, failed messages, query latency, and replay volume.
Services built on this work
Have a similar production problem?
Send the current architecture, bill concern, deployment pain, or GenAI reliability issue. I will help you find the first real bottleneck.
 Request the reliability audit