AWS Cost Optimization and FinOps Review
A review of your AWS and LLM spend that maps what drives the bill, lists the reductions that are safe to make now, recommends right-sizing and commitments, and sets up the guardrails that keep the savings.
The AWS or LLM bill is climbing faster than confidence, and nobody knows which usage is worth keeping.
 Request an AWS cost audit
Best fit
Teams with real traffic, multiple AWS services, and enough spend that cost mistakes now affect roadmap decisions.
Timeline
1-3 weeks
Proof frame
Sanitized examples can be discussed with sanitized or NDA-safe detail.
Symptoms first, architecture second.
The useful work starts by naming what is hurting, what can be measured, and what can be changed safely this week.
What you may be seeing
- Bill spikes are discovered after finance asks
- Idle or oversized resources have unclear owners
- S3, logs, data transfer, NAT, or model calls grow silently
- Savings Plans or commitments feel risky because workload shape is unclear
How I find the cause
- Cost Explorer, CUR, tags, accounts, and workload ownership
- compute, database, storage, logging, NAT, and data-transfer hotspots
- serverless and LLM/token cost per business action
- commitment risk, lifecycle policies, and unit economics
The output has to survive handoff.
The point is not a prettier diagram. The point is a plan that names service boundaries, owners, rollback, cost drivers, and what gets observed.
I will not promise blanket savings without billing and utilization data. The useful answer is what to cut, what to keep, and what to measure next.
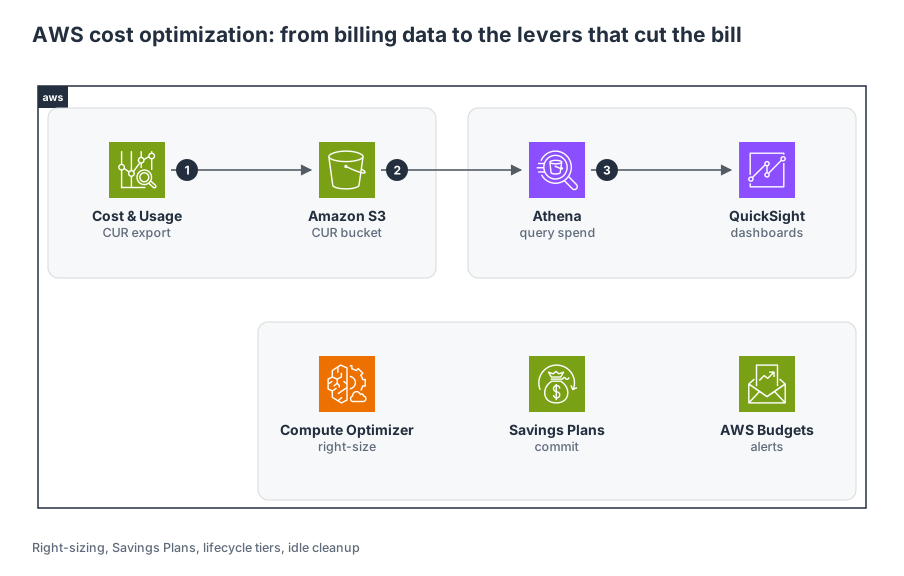
What you get
- - cost driver map
- - quick-win reduction list
- - commitment and right-sizing recommendation
- - LLM/token cost guardrails where relevant
- - FinOps operating cadence
What to bring
- - billing access/export
- - service ownership map
- - traffic or usage history
The method behind this service, written up.
Case studies behind this service.
Cloud Cost Optimization
Multi-Client · Freelance
Combined blind spend cut up to 55%; idle EC2 eliminated; SP coverage from 0% to 78% where it fit.
- Savings Proof
- Sanitized
- Cost Red., up to
- 55%
- Clients Served
- 3
SaaS Platform Arch
ProdigyBuild
ClickOps + slow environments blocking ship → serverless API with a 99.9% availability target, 40% AWS cut, envs in minutes.
- Availability target
- 99.9%
- Cost Red.
- 40%
- Dev Velocity
- +60%
Event-Driven Commerce Migration
Major QSR e-commerce platform (Thailand) · Imaginato
Peak-hour monolith failures + inflated EC2 → 5M+ orders/mo, P99 <200ms, ~30% infra reduction.
- Orders/Mo
- 5M+
- Latency
- <200ms
- Cost Red.
- 30%
Questions before you book.
Do you guarantee a percentage of AWS savings?
No. The public narrative uses documented/sanitized savings ranges, but each engagement starts from billing and utilization data.
Can GenAI cost be included?
Yes. I inspect cost per request, retrieval design, semantic cache fit, model routing, prompt/context size, and eval-driven quality trade-offs.